The Results section should be structured around the Research Questions and/or Research Hypotheses developed in Write Purposes, Research Questions, and Research Hypotheses. However, if you are writing a thesis, then the demographics of the participants might be included in an introductory section to Chapter 4. If this is the case, see Write Sample Section for the demographic information that should be included at the start of the Results so that the readers will be able to make a judgment of whether the sample is representative of the population.
Start the Results section by reviewing the purpose of the study. The purpose of the study was described clear back in the Introduction. Since then, the reader has read the Literature Review and Methods sections, so it is quite probable that they have forgotten the purpose of the study. A brief refresher of the general purpose of the study is helpful.
The rest of the Results section will answer each Research Question and/or Research Hypothesis one by one, in the order that they were listed in Chapter 1. See the guidelines below for presenting the results of the Research Questions and Research Hypotheses.
- Write the Research Question/Hypothesis. It is important that the reader is reminded of the Research Question/Hypothesis before the statistics are described. The reader should not have to flip back to the introduction to understand what variables are being analysed.
- Explain the statistic used to answer the Research Question/Hypothesis. The appropriate statistic was already selected in Method of Data Analysis. Describe the rational for selecting that particular statistic, and which variables were entered into the statistic.
- Explain the measurement of each variable. Analysing the data requires that each variable is translated into numbers or labels. However, how those numbers or labels were arrived at in the data analysis is often not apparent. Therefore, explain how each variable was translated into numbers or labels. If the variable is academic achievement and students completed an exam, explain how the final score for each student on the exam was calculated. If the variable is intrinsic motivation, explain that the scores on the five intrinsic motivation items on the questionnaire were averaged to get a total motivation score. If responses to an open-ended interview question were coded into themes, explain how the themes were determined and how the interview responses were coded. The reader should have a clear understanding of all of the numbers that will be presented in the statistics and how the numbers were calculated based on the data collected
- Present the statistics. Most likely, the statistics will be presented in a Table or Figure.
- Interpret the statistics. What are the key statistics that are important for answering the research question? If analysing a Research Hypothesis, explain the finding: was the statistic significant? However, you cannot just say the finding was significant; it is vital to also explain the meaning of the significant result. If comparing different groups, which group had the highest mean score? If examining the effect of one variable on the other, explain what that effect is. If a significant relationship is found, explain the nature of that significant relationship.
One of the most common errors I find in reporting of the Results is a lack of clear reporting. Numbers are reported in a table, but it is unclear how the numbers were calculated based on the items from the questionnaire. The reader should know how each statistic was calculated based on the questionnaire items.
A second error is that the statistics are not thoroughly explained. Research hypotheses particularly need a detailed explanation to interpret the key findings. However, an opposite mistake is to repeat all statistics from the Table or Figure in the body of the text. Not all statistics from the table or figure need to be repeated, only those key statistics that are necessary for interpreting the key findings. If all of the statistics are reported in the body of the text, there would be no need for the Table or Figure
Below are three sample reports of the results. Notice how all statistics are clearly explained. Each step presented above is noted by its number in the examples.
Example Research Question Result.
|
(1) The first research question asked whether Nigerian university students believe that engaging in academic malpractice is acceptable. Table 1 presents each cheating behavior that was listed on the questionnaire and the percentage of students (2) who responded that the cheating behavior was Never Acceptable (3). The mean acceptability factor was also calculated by averaging responses (9-point Likert Scale with 1 as Never Acceptable and 9 as Always Acceptable). (4)
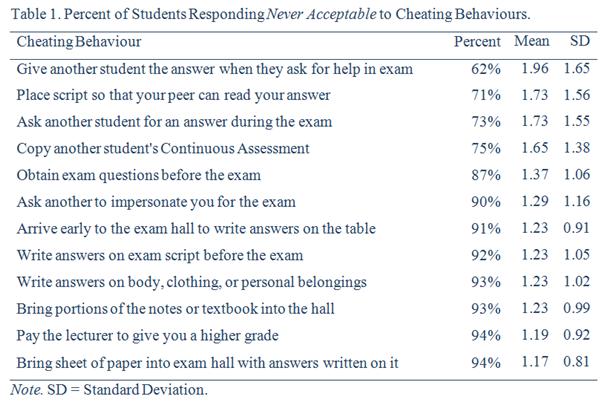
(5) As can be seen from Table 1, the majority of university students believe that most cheating behaviors are never acceptable. Except for four types of cheating behaviors, over 85% of students agreed that these cheating behaviors were never acceptable. The four exceptions include sharing answers during an exam (i.e., give help during an exam, place the script so students can read your answer, and ask for an answer during an exam) and copying another student's Continuous Assessment. However, the percentage of students who rated these four behaviors as never acceptable was still over 60%.
|
Example Significant Research Hypothesis Result.
|
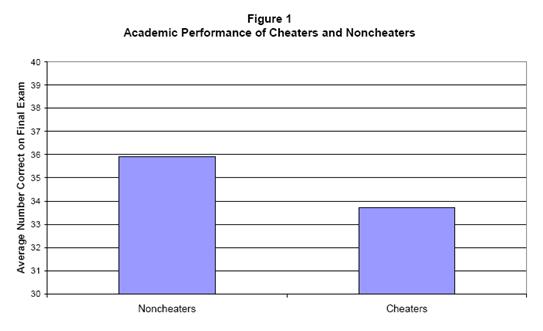
(1) The first research hypothesis stated that there is no significant difference between students who cheated and students who did not cheat on exam scores. (2) To determine whether Cheaters demonstrated lower academic performance than Non-Cheaters, an independent sample t-test was conducted. The purpose of the t-test was to determine whether the (3) average number of points that the Non-Cheaters earned on the educational psychology final exam was significantly higher than the average number of points that the Cheaters earned. (4) The one-tailed t-test confirmed that there was a significant difference between Cheaters and Non-Cheaters on their exam scores (t(226) = 1.6, p<.05). (5) Based on the mean exam scores for the two groups (see Figure 1), we can conclude that Non-Cheaters had higher academic performance than Cheaters.
|
Example Non-significant Research Hypothesis Result.
|
(1) The first research hypothesis was "There is no significant effect of educational level on teachers' beliefs of literacy development." (3) To this end, participants were classified according to their educational qualifications. At the lowest level was the pre-service teacher sample with education students who were in the first year of their formal teacher training. Next, teachers in the sample who attended the in-service training were divided into three categories: those with a National Certificate in Education (NCE, a three year program that qualifies one to teach primary school), a bachelor's degree in education, and a post-graduate diploma or degree. (2) Mean scores of the five items that measured beliefs about literacy development were entered as the dependent variable into a one-way ANOVA. (4) The ANOVA was not significant (F(3,209) = 1.07). (5) Contrary to expectation, education did not have a significant impact on teachers' beliefs of literacy development. Teachers who have higher educational degrees have the same beliefs of literacy development as individuals who are just beginning their educational training.
|
NEXT
Return to Educational Research Steps
Copyright 2013, Katrina A. Korb, All Rights Reserved