Once the statistics have been calculated, the next step is to organize the statistics into tables and figures so the reader can easily read and interpret the statistics. The key to making both tables and figures is to make them clear, both in appearance and in interpretation. When you have finished a table or figure, critically look over it. Will the reader be able to understand what everything in the table/figure means? A good practice is to ask a peer to review the table and give their comments about how it can be more clear.
TablesAccording to APA, tables enable a researcher to present a large amount of numerical data in a small amount of space. When developing a table, consider two seemingly contradictory requirements:
Here are a few rules to keep in mind when creating a table:
APA (2001, p. 175) gives this checklist when developing tables:
Below is an example of a table that follows APA format:
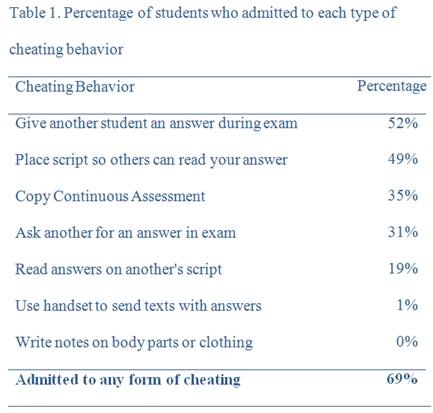
Each of the tables below has some problems. Identify the problems in each of the tables.
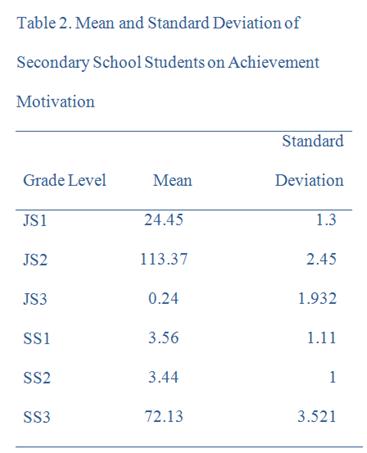
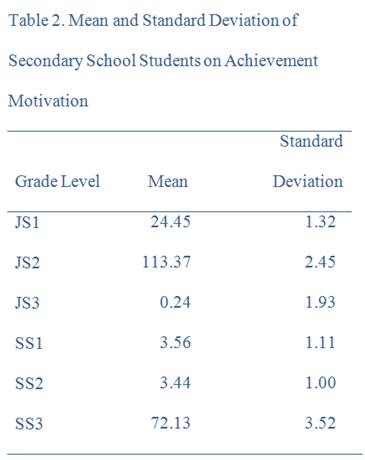
Notice the numbers in this table. Under the Mean heading, all numbers have the same decimal places (two), but the decimal point is not lined up. It is not easy to see that JS2 has the highest number. Under the Standard Deviation header, the numbers are all rounded to different decimal places. All numbers in this column should have the same number of decimal places: two. Here is a corrected version of the table:
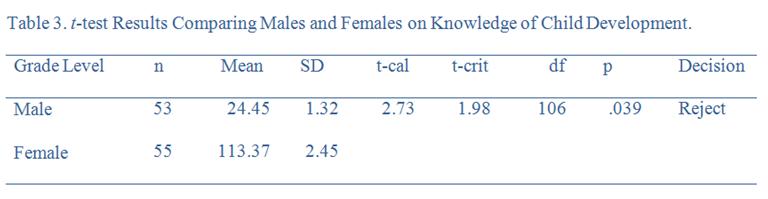
What is wrong with this table?
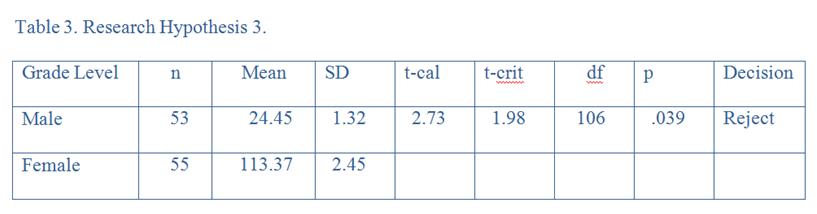
First, the table has vertical rules. Second, the title of the table does not explain what the table represents. A more detailed title should be added. Below is a corrected version of the table. Note that this is not the "APA Format" for presenting the results of a t-test. The APA Manual does not give guidance on t-test tables. Indeed, it is often more common for t-test results to be written in the text instead of being presented in a table. For example, one might say "Females were found to have significantly more knowledge of child development than males (t(106) = 2.73, p<.05)." The degrees of freedom are placed in brackets immediately after the t. Then the t-calculated value is stated, followed by the signficance of the result (p<.05). However, in Nigeria, the table below is a typical method for reporting the results of a t-test.
What's wrong with this table?
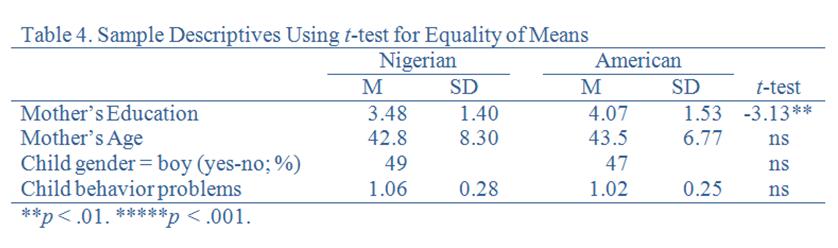
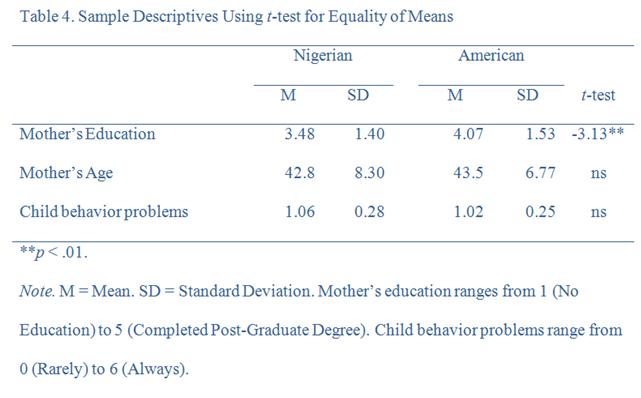
Most simply, the table is not double-spaced. However, the major problems with this table are more complex. First, the table does not explain what M and SD stand for. It is standard that M is Mean and SD is Standard Deviation, but this should still be clarified in a note at the bottom. More importantly, the mean for Mother's Education is 3.48. What does this mean? That mothers only attended 3.48 years of school? This is highly unlikely. The author probably coded education - perhaps 1 was none, 2 was primary only, 3 was secondary, etc. However, the reader does not know this! A note must be added explaining the coding. Mother's age is understandable. However, the next line is also confusing: Child gender = boy (yes-no; %). Presumably, the first part means that 49% of the Nigerian sample was a boy, but what does (yes-no; %) mean? Likewise, what does 1.06 mean for child behavior problems? Is this high (perhaps the range was 0 to 2), or is this low (perhaps the range was 1 to 6)? Without this information, this table is meaningless. Below is a corrected table with a note at the bottom to explain the table.
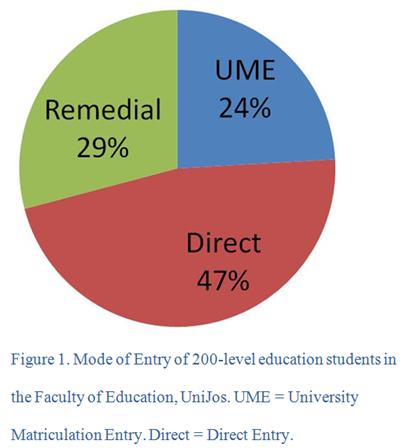
Figures can be an excellent way for readers to quickly understand and easily interpret the statistical findings. Graphs effectively illustrate means, frequencies, and percentages. Just like tables, figures should also be fully understandable without reading the text, but also be referenced in the text. Figures should also be numbered consecutively. Legends and notes should be included so the reader can easily interpret the figure. One difference is that figures do not have titles. Instead, a caption at the bottom of the figure functions both as a title and an explanation of the figure.
There are easy rules for determining the format and style of a graph. The researcher must use his/her expertise and judgment to determine whether to use a line graph, pie graph, bar graph, etc. and on developing the presentation of the graph. Again, it is helpful to have a peer review the chart to determine whether there might be a better way to assemble the graph.
Here is the APA (2001, p. 201) checklist for figures:
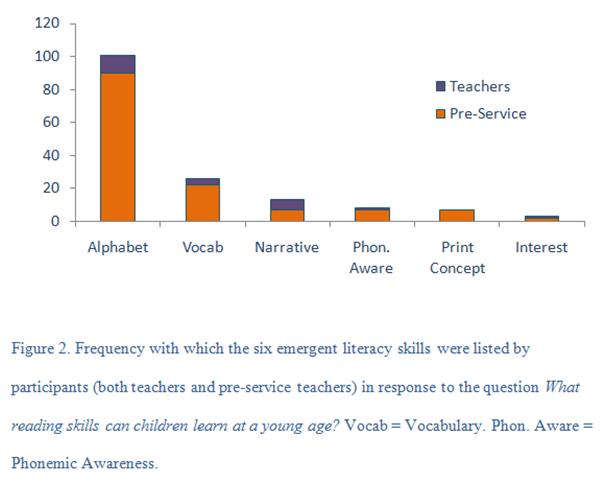
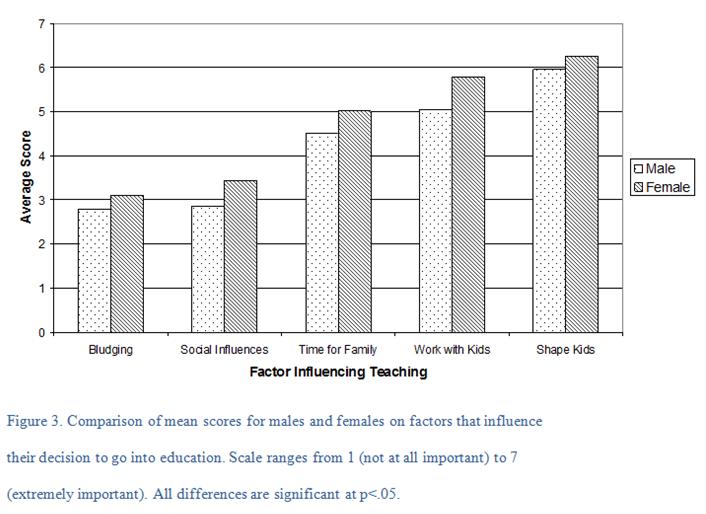
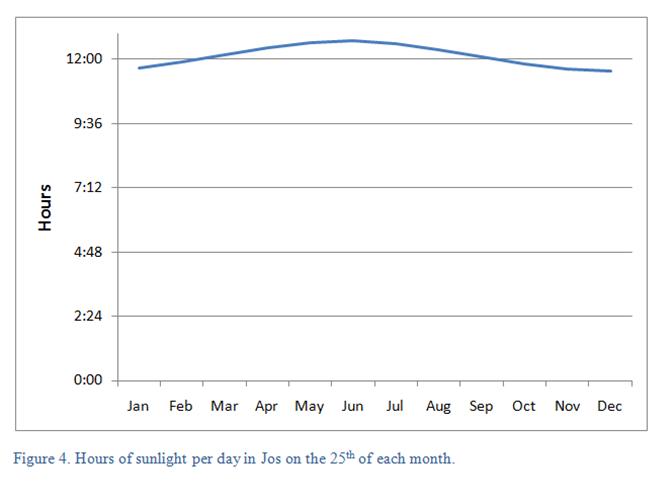
Below are some sample figures for percentage, frequency, means, and a line graph, respectively.
Return to Educational Research Steps
Copyright 2011, Katrina A. Korb, All Rights Reserved