Conducting Educational Research
Reliability of Instruments

Once an instrument has been developed, the reliability and validity of the instrument needs to be evaluated. Not all instruments are created equally - some are good instruments, some are bad instruments, and others are mediocre. Reliability and validity are the two ways that researchers evaluate the quality of an instrument. Briefly, reliability is the degree to which the instrument is consistent whereas validity is the how well the instrument measures what it is supposed to measure. The different types of reliability evidence are described below.

Overview of Reliability

Again, reliability answers the question, "How consistent is the instrument?" Imagine we are measuring a person's height. Here, height is the key variable under study, and we need to develop an instrument to measure a person's height. The most direct way to measure the height of a child is to get a tape measure and measure the child from head to foot. Reliability will reflect whether the measured height of the child is consistent. If the child measures 3'6" (3 foot, 6 inches) at one point and 3'5" at a different point, then the instrument (the tape measure) is not reliable. There are a few ways that reliability can be conceptualized, reflected in the following questions:

  • Test-Retest Reliability: Will the child have the same height when measured two months later?
  • Parallel Forms Reliability: Will Tape Measure A give the same height measurement as Tape Measure B?
  • Inter-Rater Reliability: Will Researcher A give the same height measurement as Researcher B?
There is actually a fourth type of reliability evidence that is difficult to understand using this example, but that does not detract from its importance:
  • Split-Half Reliability: Does the instrument itself consistently measure the same variable?
The point of this illustration is to demonstrate that the different types of reliability evidence measure different aspects of the instrument. Split-half reliability is typically the most important type of reliability evidence for questionnaires.

The theory of reliability is that a participant's actual score on an instrument is influenced by both their true score and error.

Actual Score = True Score + Error

The actual score is the score that is recorded when the teacher has marked the exam. The true score is a hypothetical score of what the child really knows of mathematics. It is impossible to actually measure the true score because this is the mathematical knowledge in the student's head. The error is anything that causes the actual score to be different from the true score. In other words, one would hope that the actual score (the score given to the student on the exam) reflects their true score (the student's true knowledge of mathematics), but this is not always the case. Reliability is basically a measure of the error in the instrument: the more error in the instrument, the less reliable the instrument is. The less error in the instrument, the more reliable it is.

There are many different sources of error that a researcher should be concerned about when developing and evaluating the instrument:

  • Error in Instrument Construction. This reflects how well the test was developed and how accurately the items measure the variable of interest. There is typically high error in test construction when items are not directly related to the construct definition. For example, there will be lots of error if intrinsic motivation was measured by the following items: 1) I enjoy maths; 2) I work hard in maths; 3) The maths teacher is nice; 4) Maths is hard for me. Instead of just measuring the variable of intrinsic motivation (in other words, enjoyment of mathematics), these items really measure four different variables: enjoyment, effort, math teacher, and difficulty. Because of this, there will be wide variation in responses to the four questions, resulting in low reliability. Instead, intrinsic motivation should be measured by the following items: 1) I enjoy maths; 2) Maths is fun for me; 3) I do NOT enjoy maths [Note that this is a reverse-coded item]; 4) Maths is an interesting subject. Because these four items are directly related to the construct definition, there will be low variation in responses, resulting in high reliability.
  • Error in Instrument Administration. There can also be error resulting from the time when participants actually complete the instrument.
    • Participant factors: Perhaps the participant was tired or sick when they completed the maths test. Perhaps they did not understand the test directions, or do not understand English very well. This will likely result in their actual score being lower than their true score. On the other hand, perhaps the student was lucky that day, or copied their neighbor's answers. This will result in their actual score being higher than their true score.
    • Researcher factors: Perhaps the researcher did not adequately explain the directions, or is having a bad day and is rude to the students. This might result in actual score being lower than the true score. On the other hand, if the researcher somehow gave away answers to the students - either by accident or on purpose - then the actual scores will be higher than the true scores.
    • Environmental factors: Perhaps there is a loud football game outside of the testing room, distracting the students. Maybe the test photocopy was poor, or the room was too hot, or there were many distractions while the students were taking the exams. These will all affect the actual score so it does not accurately reflect the true score.
  • Instrument Scoring and Recording. Teachers and researchers also make mistakes when they mark exams by counting an item correct when it was really incorrect, or perhaps they miscount the number of points the student earns. Perhaps they accidentally write 48 instead of 58 on the student's record. Researchers must be very careful when they are scoring and recording data. Responses scored and recorded incorrectly leads to incorrect conclusions. This is a violation of quality and ethical research.

The four different types of reliability presented above (test-retest, parallel forms, inter-rater reliability, and split-half) each measure the different types of error.

  • Split-half measures error from instrument construction.
  • Parallel forms mmeasures error from instrument construction when two or more instruments are used. (In other words, if the pre-test and the post-test are different.)
  • Test-Retest measures error from instrument administration.
  • Inter-rater reliability measures error from instrument scoring and recording when two or more researchers do the recording and scoring.

Therefore, not every type of reliability is applicable for every type of research study. For example, test-retest reliability would not be applicable to a study of children's height. Because children grow, their measured height should be different between Time 1 and Time 2. Likewise, split-half reliability of a tape measure is not logical. However, split-half reliability is typically the most important type of reliability evidence for most educational research studies. A researcher must thoughtfully consider which type of reliability evidence is most applicable to their particular study. Most educational research studies should use the following guidelines:

  • Split-half reliability is almost always required for questionnaires.
  • Parallel Forms reliability reliability is typically necessary when two separate versions of an instrument are used, such as when the pre-test and post-test are different.
  • Inter-rater reliability is necessary if examinations are used and multiple researchers mark the examinations. For example, imagine there are two teachers marking the SS3 English Exams. Inter-rater reliability would be used to examine how similar these two teachers are in the marks they give. Furthermore, inter-rater reliability should be used for qualitative research studies when multiple researchers analyse open-ended interview data, and when observation schedules are used with multiple researchers.
  • Test-retest is rarely necessary, except if a researcher is a tests and measurement expert whose research project is solely to develop and validate an instrument.

Both reliability and validity can be visualized using the game of darts. If you are unfamiliar with the game, the object is to throw a little arrow and hit the bulls-eye in the middle of the board. Visually, reliability looks like this:


The first dart board, A, is reliable because all of the darts are together - the thrower is consistent and therefore reliable. Likewise, board B is also reliable because the darts landed together and are consistent. (This board is not valid because the darts did not hit the bulls-eye in the center, but it is reliable because it is consistent.) Board C is not reliable because the darts are all over the board - it is not consistent.


How to Calculate Reliability Coefficients

General explanations for calculating reliability indices are described below. If you need help calculating correlations, click Calculating Inferential Statistics.

Split-Half Reliability
Like its name, the general idea of split-half reliability is that a test is split into two halves. Then the two halves are correlated to determine how reliable the instrument is within itself. (Because of recent advances in statistics, this isn't entirely how split-half reliability is calculated anymore, but the philosophy is still the same.)

Because split-half reliability measures how internally consistent an instrument is, a reliability coefficient should be calculated separately for every variable that has two or more items to measure it. For example, if your study examines intrinsic motivation, extrinsic motivation, self esteem, and academic achievement, then you need four reliability coefficients - one for each variable. Therefore, the first step in calculating the split-half reliability is to divide the items into the variables that they measure.

A low split-half reliability (typically under 0.70) indicates that the instrument is poorly developed and needs to be revised. In the revision, focus on writing items that are directly related to the construct and operational definition of the variable.

To calculate split-half reliability, you must have every participant's response to every single item. More will be said about coding data in Analyzing Data. However, you need a table (preferably in Excel or SPSS) that looks something like this:

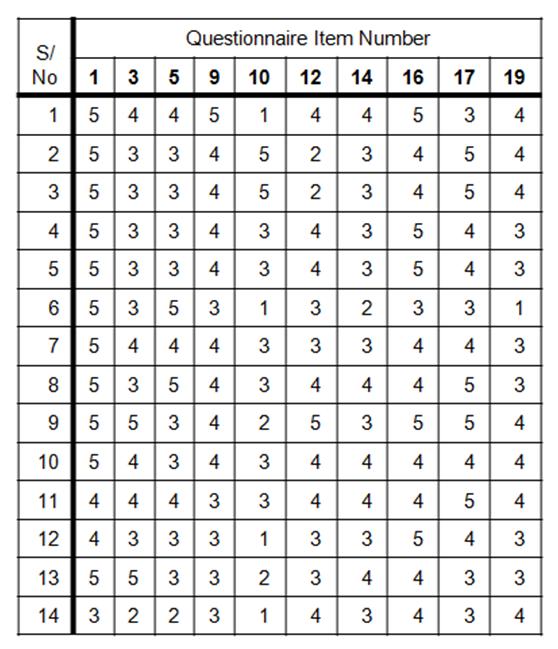
Each row is a separate participant who completed the questionnaire, listed by their Serial Number (S/No), and their responses to each of the items. Each column is a questionnaire item. Because the items measuring intrinsic motivation were spread throughout the questionnaire, items 3, 5, 9, 10, etc., were the items that measured this particular variable.

If you have access to SPSS or are mathematically inclined, it is best to calculate the split-half reliability with coefficient alpha. The formula for coefficient alpha is:

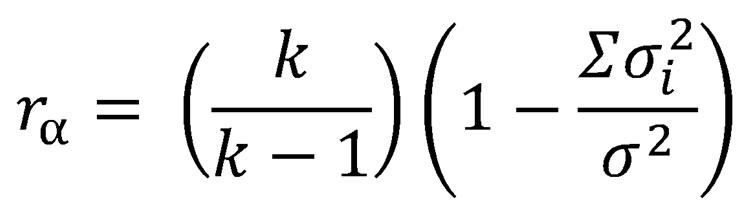
r stands for coefficient alpha; k is the number of items on the instrument that measure that variable, sigma sub-i is the variance of one item, and sum of sigma squared is the variance of the total score for the entire variable. That's complex, so only attempt to use coefficient alpha if you have been well taught how to do it.

Another option for calculating the split-half reliability is to do just that: split the items in half. In the example given above, items 1, 3, 5, 9, 10, 12, 14, 16, 17 and 19 all measure the variable of intrinsic motivation. If we split the items in half like this: 1, 3, 5, 9, 10 in one group AND 12, 14, 16, 17, 19 in the other, we might run into a problem: participants tend to get tired at the end of the questionnaire, so the second half of the items might not be as consistent as the first half, which will seriously lower the reliability coefficient. Instead, alternate the groups that the items are split into: 1, 5, 10, 14, 16 in Group A AND 3, 9, 12, 16, 19 in Group B. Then, for each participant, add up the scores on each item for Group A and the scores on each item for Group B, giving a total score for Group A and Group B. Then, those two total scores are correlated using the Spearman Brown Formula for correlations. Once that correlation is found, it is plugged into this simple split-half formula:

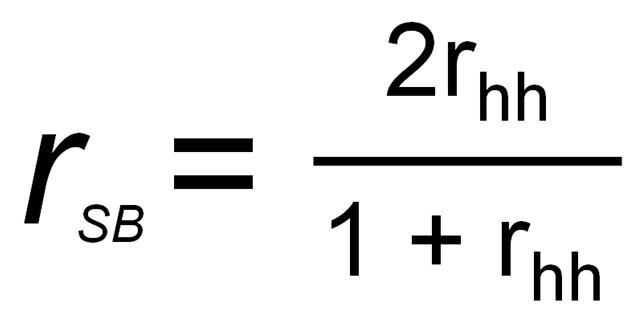
In this equation, r is the Split-Half Reliability Spearman Brown Formula, and r is the correlation between the two halves of the test.

For more details on calculating the split-half reliability, click here for a pdf file that goes into detailed demonstration of the process. (Note: Your computer must have Adobe Reader to view the document.)

Recall that the split-half reliability coefficient must be calculated for each variable that has more than one item separately. Therefore, you will have as many reliability coefficients as you have variables (that are measured by more than one item).

Parallel Forms Reliability
To calculate parallel forms reliability, first administer the two different tests to the same participants in a short period of time (perhaps with one week of each other). Then calculate the total score for each variable on the two separate tests. Your data should look something like this:

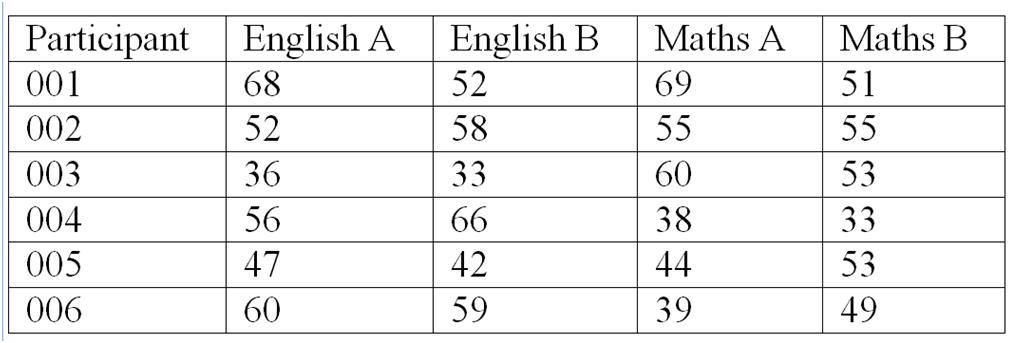
Total scores for English, Forms A and B are listed for each participant, as are total scores for Maths, Forms A and B. Now, calculate the Pearson's Product Moment Correlation between English A and English B. This is the parallel forms reliability coefficient for English. Then calculate the Pearson's Product Moment Correlation between Maths A and Maths B. This is the parallel forms reliability coefficient for Maths.

Test-Retest Reliability
For test-retest reliability, administer the same test to the same participants at two different times, perhaps two weeks apart. The data table will look similar to the Parallel Forms Reliability table above, except the columns will be entitled "English Time 1, English Time 2; Maths Time 1, Maths Time 2." Again, the Pearson's Product Moment Correlation should be calculated between English Time 1 and English Time 2. This is the test-retest reliability coefficient for English. Then calculate the Pearson's Product Moment Correlation between Maths Time 1 and Maths Time 2. This is the test-retest reliability coefficient for Maths.

Inter-Rater Reliability
Inter-rater reliability is used to calculate how consistent two "raters" (typically researchers or research assistants) are when they score the same test. The purpose of inter-rater reliability is not to correlate test scores, as are the previous three types of reliability. Instead, the purpose is to determine how consistent the raters are in their marks. Therefore, give the exact same tests to two raters, meaning that the same test will be marked by two different people. The data should look like this:

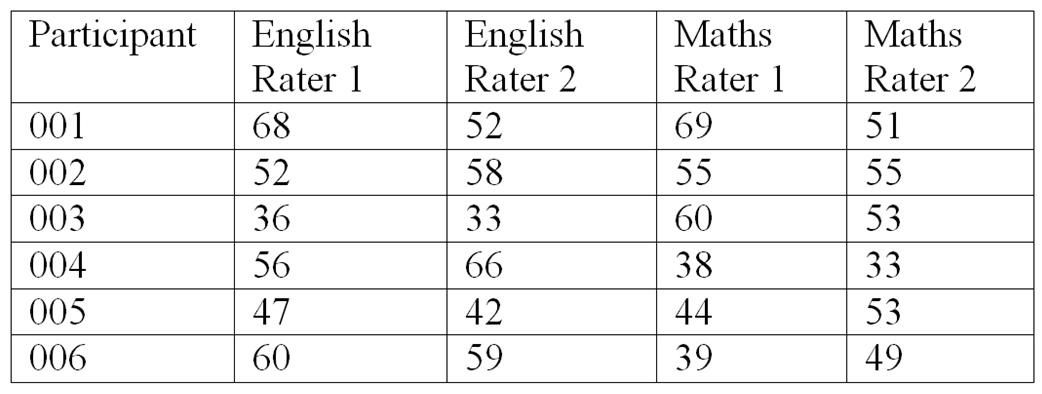
Rater 1 is the first teacher/researcher and Rater 2 is the second teacher/researcher. Calculate the Pearson's Product Moment Correlation between Rater 1 and Rater 2 on the English test, and again the Pearson's Product Moment Correlation between Rater 1 and Rater 2 on the maths test for the inter-rater reliability coefficients. A more advanced Kappa statistic should be used for inter-rater reliability for interview and observation data,


NEXT

Return to Educational Research Steps

Copyright 2012, Katrina A. Korb, All Rights Reserved