At this point, you should have a pile of instruments that have been completed by the participants. The next step is to enter the data into the computer so you can easily analyze the data. Because you will not be entering in the entire response of every participant, this process is called Coding the Data because each response is given a code.
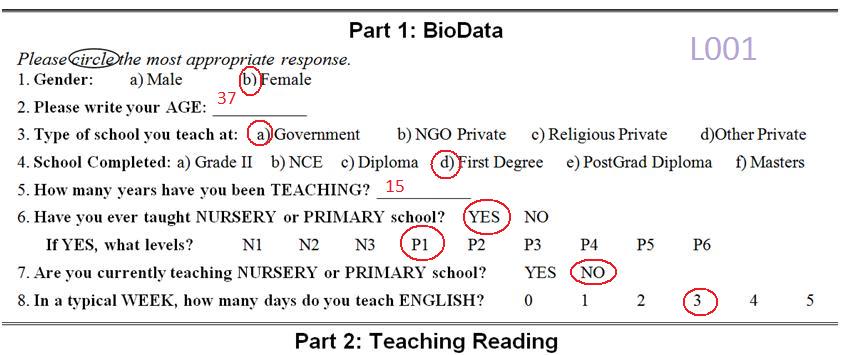
Number the Completed QuestionnairesThe first step in coding data is to write a code number on each completed questionnaire. The reason for this is to be able to link the data that is entered into the computer to the actual questionnaire that the data came from. For example, after a questionnaire has been entered into the computer, it might be found that there is an error in one of the responses - perhaps the number 9 is entered, but it is impossible to have a 9 as a response. Therefore, the researcher will need to go back and find the actual questionnaire to see what the correct response should be. This would be impossible unless the questionnaires were numbered. I recommend starting with a letter that somehow represents the questionnaire or the sample, perhaps "L" for Literacy, and then 3 numbers, starting with 001, 002, 003...010, 011...all the way up to the total number of questionnaires that were collected. Write this number largely on the top of the questionnaire. For example, below is the first completed questionnaire. Note the serial number in light blue on the top right corner.
It is typically easiest for data to be entered into Microsoft Excel because this program allows a person to easily enter the data, calculate descriptive statistics, and make graphs. The best way to enter data into the computer is to make a matrix with each questionnaire item across the top, and each completed questionnaire going down.
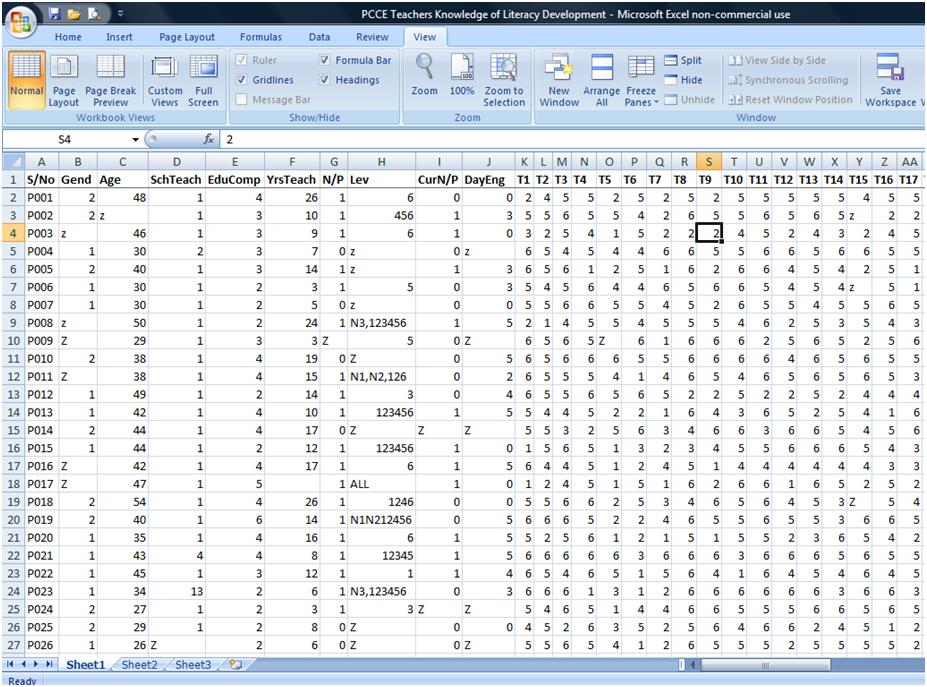
Here is the coded data for the questionnaire given above. Notice the top row has bolded identifiers for each item in the questionnaire: S/No is the Serial Number written on the questionnaire itself, Gend is gender (item 1), Age (item 2), SchTeach is the type of school taught at (item 3), etc. Each row after the first are the responses given on each questionnaire. Row 2 has the responses for questionnaire S/No P001. Row 2 has the responses for questionnaire S/No P002, and so on.
When doing data entry, take each questionnaire and enter the correct code for the response given to each item. Be sure to be very careful when doing data entry to ensure you do not make careless computer typos. Incorrectly entering data is sloppy research and can have a serious negative effect on the outcomes of your study. Therefore, double-check every questionnaire to ensure the correct responses are indicated in the correct columns. To help double-check your work, after you have entered the data in the computer, ask a peer read out the responses to each questionnaire as you check the entry in the computer
As previously stated, this step is called coding the data because each response is given a number or letter code and then entered into the computer. Below are some tips that can help you determine which code to give for which response. If you are a new researcher, it might be helpful to get a blank questionnaire and write the code for each response so you do not forget what code you assigned to each response.
Sometimes responses are already given a code. For example, in the questionnaire above, the first item, Gender, has already been given a code: a for Male and b for Female. Therefore, you can easily enter a or b instead of typing out "male" and "female."
Other times, personal information data have not already been given a code on the questionnaire. In these cases, you can typically use the first letter of the first word of the response: M for Males and F for Females. Be careful that each response gets a unique code, though. For example, consider an item that asks participants to indicate their level of education completed. Two of the options might be Primary and Post-Graduate. If the first letter of the first word is used for the codes, then both responses would be coded P. At the point of data analysis, it would be impossible to tell which response was actually indicated. In this case, you could go to the second letter, such as I for Primary and O for Post-Graduate.
Or, each response can be given a number for the order in which they appear. For example, for item 3 on the questionnaire given above (type of school attended), Government would be coded as 1, NGO Private coded as 2, Religious Private coded as 3, and Other Private coded as 4. Because these codes are not written on the questionnaire itself, it is best to make a sheet that reminds you of the codes given to each response for future reference.
Other items have a straight-forward code. For example, in the questionnaire above, the second item is Age. Whenever a number like this is written, you can simply enter the number that is written.
Item 7 on the questionnaire (are you currently teaching nursery or primary school) has a Yes/No response. Yes responses are typically coded as 1 and No responses are typically coded as 0.
When it comes to responses to Likert-Scale items, enter the number of their response: oftentimes 4 for Strongly Agree, 3 for Agree, 2 for Disagree, and 1 for Strongly Disagree. In the Excel example given above, items T1 through T17 are the Likert Scale responses. (I used a 6 point Likert Scale with Strongly Agree, Agree, Somewhat Agree, etc.) However, do not forget items that are to be reverse-coded. Read below for how to treat reverse coded items.
Despite seeming straight-forward, data coding oftentimes requires some tricky decisions by the researcher, including what to do with missing or unclear data.
Every research study will be faced with the question of what to do with missing data. Participants will not answer certain items on a questionnaire, perhaps because they were tired, perhaps they did not want to answer, or maybe they did not see the item. It is to be expected that there will be missing data, and this is ok. However, what is not acceptable is to make up a response for the participant, or to assign a response to the participant without reporting in the study what procedures that were used to assign the response. Researchers have developed a number of procedures for handling missing data as described below.
The easiest way to handle items that were skipped on the questionnaire is to simply discard the item for that particular participant. I typically enter Z for missing items because z is rarely coded for any other response. For example, if a participant did not indicate their gender, I will type Z. Then when I am analyzing data, I know that person did not indicate their gender. Note on the Excel image above that at least 6 participants did not indicate their gender. When reporting the gender of the participants, then I would report that 65% were female, 25% were male, and 10% did not indicate their gender.
There will also be items where it will be difficult to determine what the participant ticked. For example, you might not be able to read the numbers they wrote for their age. For other items, they might have circled two responses (such as Strongly Agree and Disagree). If this is the case, since it is not clear what the correct answer is, it is typically best to enter that item as missing, Z.
More difficult decisions must be made when participants miss much more just a few items. Sometimes participants do not complete one entire portion of the questionnaire, or they only complete the first page. If too many items are not answered, I typically discard the entire questionnaire from analysis. The criteria for discarding questionnaires must be decided before data entry begins to avoid bias in deciding which questionnaires to discard. For example, a simple criteria is that the participant must complete at least half of the questionnaire in order to be included in the study. However, any time a questionnaire is discarded, the details must be described in the research report. "Three questionnaires were discarded because they did not complete more than half of the items on the questionnaire."
In more complex studies, such as pre- and post-test experiments, sometimes participants will have completed one phase of the study, such as the pre-test, but are absent for the second phase. If a participant does not complete a phase of the study, they generally are discarded from the entire study. Therefore, if a student was absent on the day of the post-test, the researcher either has the option of returning a few days later to administer the post-test or remove that participant from the study.
In experimental designs, some participants will also likely miss a substantial portion of the treatment. Before the study begins, the researcher should consider how much of the treatment the participant must attend to be included in the study, perhaps at least half of the treatment sessions. In both cases just described, the researcher must report how they handled this type of missing data. "On the day of the post-test, four students were absent. Three of these students took the post-test two days later, but one student had transferred schools so he was removed from analysis."
In other cases, perhaps a participant is only missing one score. For example, a study might examine the effect of study skills training on academic achievement, measured by scores on exams of English, Maths, Social Studies, and Chemistry. Let's say a student took every exam but Chemistry. The researcher now has three options: the student can be removed entirely from the study, the student can be included in the analyses for English, Maths, and Social Studies since she has a score for those tests, or advanced statistics can be used to create an estimated score for the student's Chemistry exam. In most cases, I recommend the second option where the participant is included in the analyses for English, Maths, and Social Studies. Again, in keeping with the ethics of transparent research methods, the researcher must report which procedure was used.
Many questionnaires will contain items that need to be reverse coded. These are items that actually say the opposite of what was intended. For example, a researcher might be studying the variable of Enjoyment of School. Most items will read something to the effect of: "I enjoy going to school." However, one or two items might read: "I dislike school." Since this item says the opposite of what is intended (the opposite of enjoying school), the researcher must assign the opposite code to the item. Agreeing to "I dislike school" is actually Disagreeing to the overall variable of Enjoyment of School; Strongly Disagreeing to "I dislike school" is actually Strongly Agreeing to Enjoyment of School. See below for an example of the correct codes when reversing items.
| Response | Typical Code | Reverse Code |
| Strongly Agree | 4 | 1 |
| Agree | 3 | 2 |
| Disagree | 2 | 3 |
| Strongly Disagree | 1 | 4 |
Note how the typical code counts down from 4, while the reverse code counts up from 1. Follow this same pattern if more Likert Scale options are given.
Once the data has been entered into the computer and the data entry has been double-checked, the next step is to calculate scores for variables that had multiple items on the questionnaire. For example, the variable Enjoyment of School is likely made up of multiple items:
Before calculating the total score, however, ensure that the reverse coding has already been done for any items that reflect the opposite of the overall variable. If reverse coding has not been done, then this total score will be inaccurate. Below is a table with three participants' responses to the four items that measure Enjoyment of School, and their total score as reflected by the mean.
| S/No | Item 3 | Item 9 | Item 17 | Item 25 | Mean |
| L001 | 4 | 3 | 4 | 2 | 3.25 |
| L002 | 2 | 1 | 2 | 2 | 1.75 |
| L003 | Z | 4 | 4 | 3 | 3.67 |
For S/No L001, the mean of the four items that measure Enjoyment of School is 4+3+4+2 divided by 4, which was 3.25. This means that this participant was slightly higher than agreeing to all of the items. S/No L002 had a mean score of 1.75. Since the scale had 2 as disagree, it means that this participant largely disagreed with the items, meaning they do not enjoy school much. Note that S/No L003 had a missing score on item 3. The mean for this item, therefore is 4+4+3 divided by 3.
The mean score is now the score for the variable Enjoyment of School. We can see that S/No L003 had the highest enjoyment of school, followed closely by L001. However, L002 has a low enjoyment of school. Any Research Questions or Hypotheses about Enjoyment of School should use this mean score for the analysis. Once this total score has been calculated for each relevant variable, the next step is to start calculating some statistics.
Return to Educational Research Steps
Copyright 2013, Katrina A. Korb, All Rights Reserved